Crypto trading / Understanding Bot history trades a little better
When it comes to choosing a bot that you want to use, it gets a little difficult to choose the right one, and also even more difficult to choose the proper budget planning for a trading bot.
AICOINPAL provides tools, trade history reports and charts to make it a little easier for a user to understand which bot is better for his needs and also what kind of a budget to use, for a single bot or for bot groups.
Here we gonna look at Rsi Trading bot chart data in JPG file.
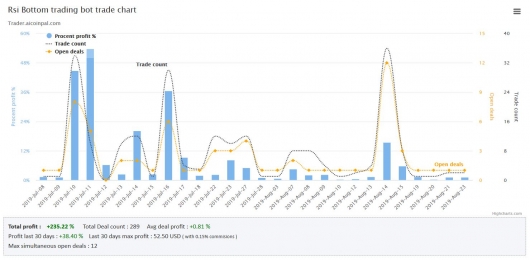
This chart shows days when bot has made trades, it shows in blue bar how much profit in % it has gained in this day, and also how many trades it has made in the dotted black line, and on the orange line you can see how many trades the bot had simultaneously opened.
There are couple important factors here, that must be noted.
When you have budget of let's say 1000$, you need to plan your trades the most optional way so you get most $ growth at the end of the month.
Let's say the bot made a 25% profit in a month, and had 10 open trades with eaqual budget on each trade, then at the end of the month your capital has grown by 25/10 = 2.5% which is 25$
When you have 1000$ and plan your budget with maximum of 5 open trades, then your calculation turns out to be 25/5 = 5% a month which is 50$, which is twice the amount than 10 open deals.
When you look at this chart, you see that there were days only with 1 opened deal for the bot, and there were days with 12 opened deals for month.
The day when bot had 12 opened deals a month the blue bar wasn't that high making the bot in effective at that day regarding to 12 open trades it had that day.
But on the left side you can see the blue bars were much higher making greater profits that day, and max opened deals were half as the blue bar on the right side. Giving us a point that most profit was earned with only 5-8 max opened deals.
When we calculate 12 opened deals with 1000 budget we would place 1000/12 = 83$ on a trade. Giving us 235% a month would end up in
83*2.35 =195$ profit which would be around 19.5% over all with 1000$
But if we reduce opened deals to 6, we will receive some notifications that bot cannot take trades because budget is used fully on the day when bot had 12 opened deals. We would miss 24% of profit but the result would be 1000/6 = 166$ on a trade Giving us 211% profit per month, is equal to 166x2.11 = 351$ which is 35.1% of our capital growth compared to 19.5% with 12 opened deals.
Now this is only calculated on a one bot, but users can take several bots and trade on several bots, so they need to compare the dates for bot deals and find a balance between theire budget.
Also keep in mind these charts do not calculate your trading fees from exchange, you need to separate them from your results. Binance has small commisions, but each user has their own commision rates based on theire account status and trading volumes.
Rent a profitable trading bot
Top 3 traders
Top : 1
ma****@gmail.comAvg Trade time : 6 hours Opened deals : 5 Total deals : 284
Last update: 3 years ago
Top : 2
sa****@inbox.lvAvg Trade time : 6 hours Opened deals : 11 Total deals : 459
Last update: 3 years ago
Top : 3
as****@gmail.comAvg Trade time : 5 hours Opened deals : 3 Total deals : 332
Last update: 4 years ago